The mystery of the vanishing record
A record goes in. Sometimes it comes out wrong. Sometimes it doesn’t come out at all. And on the day I joined, nobody could say why — not because nobody was smart enough, but because the system had no memory. It couldn’t tell its own story.
Think of every service the record passes through as a room in a building. The record walks in the front door, and gets handed from room to room until it’s done:

Seven rooms, one front door. Simple enough — except it isn’t quite that simple. A few of the doors between rooms are unusual, and each one turns out to matter later in this story.
Door #1: a conveyor belt, not a handshake. Most rooms hand the record directly to the next one. Rooms 1 and 2 don’t — they use RabbitMQ, a queue, sitting between them like a conveyor belt instead of a handoff:

Door #2: an outside courier, mid-building. Somewhere between Room 3 and the rest, the record leaves the building entirely and goes back through NiFi — the same tool that walked it in the front door — before coming back inside to keep going:

Door #3: someone doubles back. Room 7 doesn’t just finish the job — sometimes it needs something from Room 3 and calls it directly, out of order:

A conveyor belt, a courier who leaves and comes back, and a room that calls backwards. Keep those three in your pocket — they’re the whole reason this was hard, and they’re where the story is going.
Nobody could tell the same story twice
Here’s how you’d investigate a vanished record, on the day I joined: pick a room, open its logbook, read every line by hand, and guess. Nothing in any room’s logbook said which entries belonged to which record. Nothing connected Room 1’s story to Room 2’s story, let alone across a conveyor belt, an outside courier, and a room that calls backwards.
- No shared identifier. Nothing tied a log line in one room to the log line it caused in the next.
- One logbook at a time.
kubectl logs, manually, per service, per pod — seven times over, minimum. - Timestamps instead of proof. Guessing whether two log lines three seconds apart, in two different rooms, were even about the same record.
- The building’s vital signs lived somewhere else entirely — metrics, disconnected from both the logs and the record that caused them.
- Every incident started from zero. Find the pods, guess the time window, stitch the story together by hand, and hope nothing restarted and rotated the evidence away in the meantime.
That’s not investigation. That’s guesswork with extra steps.
What a good detective actually needs
Three questions come up in every incident, every time:
- What happened, in order, across every room this record visited? (tracing)
- What did each room say while it was happening? (logs)
- Was the building already unwell before this record even arrived? (metrics)
The problem was never a missing tool. It was that logs, traces, and metrics spoke no common language. Fixing that mattered more than which product did the fixing.
Don’t shout into every room — install one intercom
The tempting shortcut: wire every service straight to its own logging tool, tracing tool, and metrics tool. Rejected on purpose, for reasons bigger than convenience:
- Multiple destinations, not one. This is a multi-tenant, self-hosted platform — some customer deployments also wanted their own copy of the application logs flowing into their own database or SIEM, on top of what we needed for our own dashboards. Wiring each service directly to a backend means adding a new exporter to seven-plus services, every single time a destination changes. An intercom system means one new line in a config file.
- One point of distribution. The collector hears everything once, and repeats it as many times as needed — to our own dashboards, and to whatever a given customer’s environment requires — without a single service knowing or caring who’s listening.
- A new listener has to be cheap to add. A customer asking “also send our logs to our own database” should be a config change, not a code change rolled out to every microservice.
- No room needs to learn a vendor’s dialect. Every room speaks one language — OpenTelemetry — and never needs to know or care what’s on the other end of the wire.

One intercom, fed by every room, repeating to three purpose-built backends — plus whatever a given deployment needs on top — and one Grafana screen in front of all of it, so nobody has to remember which tool answers which question.
Teach the trick once, not seven times
None of this works if instrumenting a service is a manual chore developers forget, skip, or get slightly wrong seven different ways. Luckily every room already shared one thing: a common internal library everyone depended on for cross-cutting concerns. That’s where the fix landed — extended to own the entire OpenTelemetry setup on its own: wiring the SDK, propagating the trace on every outbound call, and stamping every log line with the same ID, self-configuring from one standard YAML block.
Onboarding a new room now takes two steps, full stop:
- Add the dependency to the build file.
- Add or update the YAML config block (collector address, service name, sampling rate).
No developer writes a span. No developer wires an SDK. No developer touches a correlation ID by hand. The library does it the same way, every time — so the quality of the trace never depends on who happened to write that particular room.
The baggage-tag trick
Here’s the idea underneath everything above, in one sentence: attach an ID to the record the moment it arrives, and make sure every room passes that same ID to the next one — like a baggage tag at an airport. Nobody needs to know what’s inside the suitcase. They just need to keep the tag attached when they hand it off.
That “tag” is a real, standard thing: a W3C traceparent header, riding along on every call,
plus the same value pushed into every room’s log context (MDC) so every log line carries it
too. Simple, as long as every room speaks the language that reads and re-attaches tags.
The problem: two rooms in this building don’t.
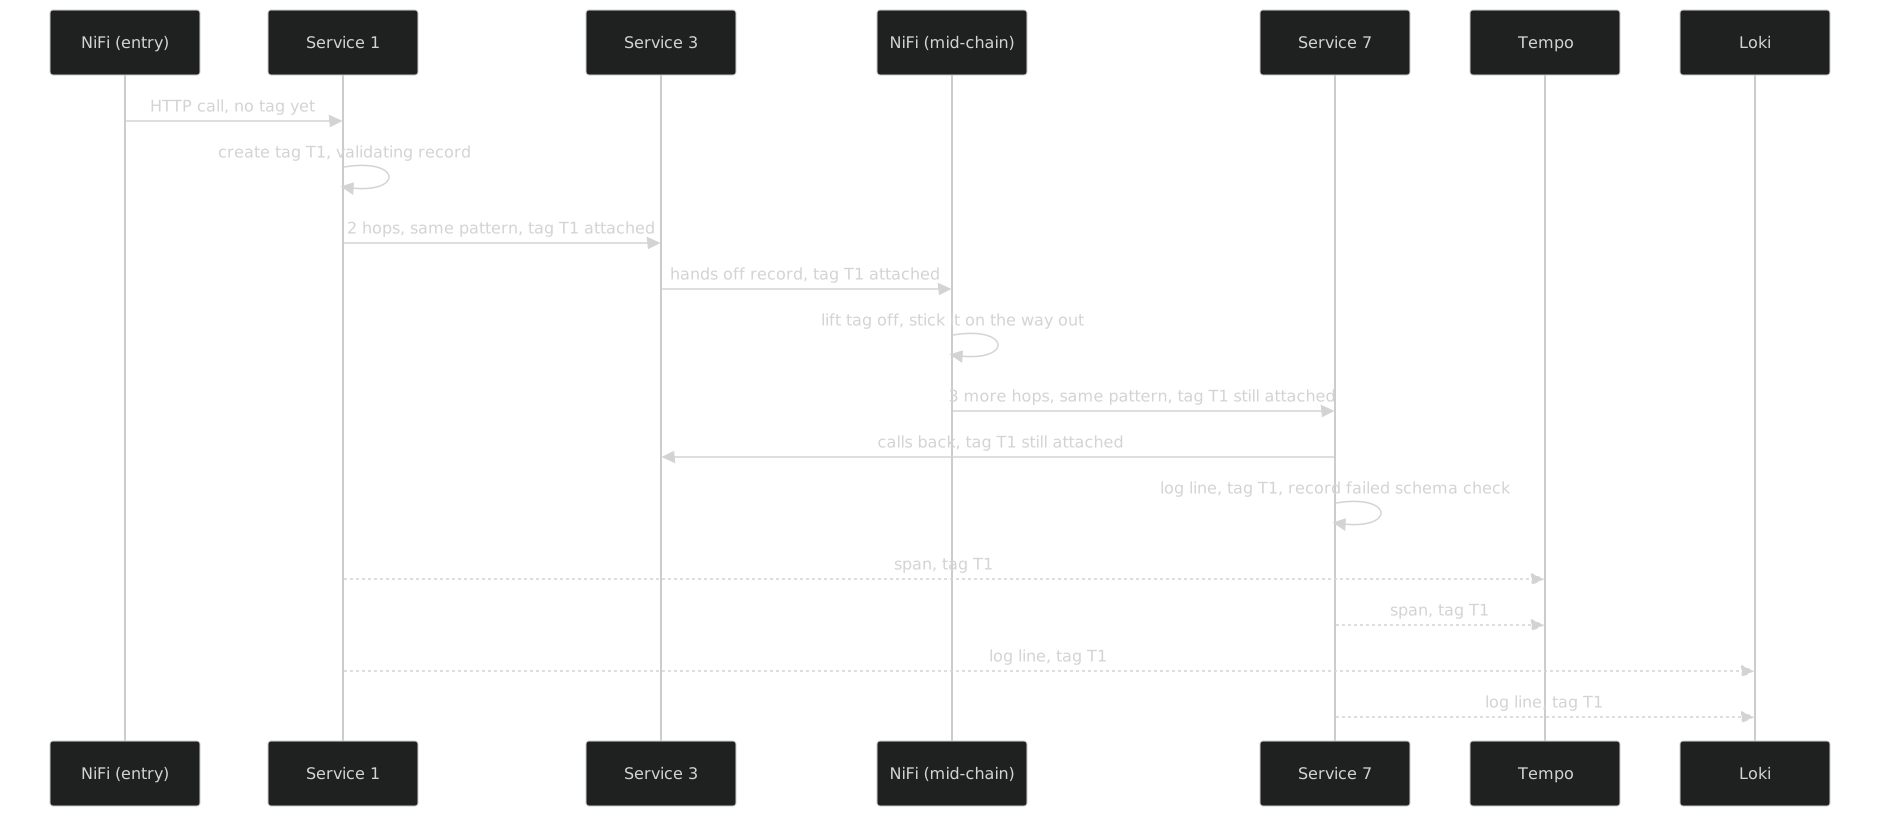
NiFi, at the front door, has no tag to relay. Nothing arrives before the front door — no upstream caller carries a tag to begin with, because this is where the record first exists. So the tag gets created at Room 1, the first room that actually understands tags. The short walk from the front door to Room 1 stays untagged — a known, accepted gap, not an oversight.
NiFi, in the middle, is holding a record that already has a tag. By the time it comes back
through NiFi, Room 3 already tagged it. NiFi doesn’t need to read the tag or understand it —
it just can’t be the room that loses it. So NiFi does the one thing it’s good at: carrying
things without opening them. A NiFi processor lifts the incoming traceparent value off and
sticks it onto a FlowFile attribute; the outbound call is configured (via InvokeHTTP’s
“Attributes to Send” setting) to stick that same value back on as a header going out the other
side. No OpenTelemetry SDK ever runs inside NiFi. It’s a courier, not a reader — and that’s
exactly enough.
The conveyor belt gets the same trick. When Service 1 publishes to RabbitMQ instead of calling Service 2 directly, the shared library rides the tag along as a message header on the way in, and reads it back off the same way on the way out. The belt doesn’t know what a trace is either. It doesn’t need to.
Put every room, both doors, and the backwards call from Room 7 into one picture, and the tag’s journey looks like this:
How the story ends now
Paste the tag into Grafana. Get the entire journey — every room, the conveyor belt, the trip back out through NiFi and in again, the call backwards — as one waterfall, in order, with every log line one click away from the exact moment it was written. No guessing which pod. No eyeballing timestamps. No archaeology.
Nothing here is one dramatic number. It’s a category change in what debugging feels like:
- An incident that used to start with “okay, which room do I even open first” now starts with “paste the tag.”
- New engineers stopped needing a guided tour of the building, because the building now explains its own shape.
- Teaching a new room the trick stopped being a manual, skippable chore — it’s a dependency and a config block, applied the same way every time.
- Logs, traces, and metrics stopped being three separate stories held together by memory and luck. They’re one screen, one shared language, one tag.